Neural Basis of Decisions current lab projects
Algorithmic basis of reward-based decisions in dynamic environment
In probabilistic reward foraging task (Fig.1A) animals’ choices tend to reflect the previous rewards, in a way that biases animals’ future choices to options from which they recently received the rewards. In addition to the reward history effects, curiously animals choices also depend on the previous choices, phenomenon that is not easily explained by the current computational models (Fig.1B). We are formulating normative accounts of why choice history effects should persist in animals. The insight into this phenomenon may give clues to why in certain psychiatric conditions humans persevere in their choices even to the detriment of future gains.
Neural representation of reward-based decisions
Using the reward probabilistic task, we record the neural activity from medial prefrontal cortex (mPFC) area known to integrate multiple sources of information from sensory, motor and internal states of the animal and convert those input into adaptive decisions. Our studies show that mPFC neurons respond to sensory and motor variables of the task in a way that biases animals’ decisions to more rewarding options. However, we also see that the activity in mPFC is not always used to control the animals behavior. In the task where task relevant events are further apart from the reward outcome, activity in mPFC is converted into behaviorally meaningful actions, but when the same events are temporally close to reward outcome the same activity in mPFC is dispensable for behavior (Fig.2). We are exploring the neural mechanisms of this phenomenon. Answers to this problem can provide clues why in psychiatric patients the activity in specific brain regions is not translated to behaviorally meaningful actions.
Neural representation of timeline
Psychology of human perception tells us that the perception of present moment is not a snapshot of events at the current ‘objective’ time, but rather is a window where mind integrates past and future (expected) events. This integration window or timeline can range from several hundred milliseconds to a few seconds, adapting to current behavioral demands. The neural and synaptic mechanisms of how we and animals construct the timeline is completely mysterious, yet may hold the clue to understand the subjective experience and ultimately lead to understanding the consciousness in non human species. Preliminary evidence suggests that individual neurons play a role in constructing the timeline (Fig. 3), however, the synaptic and circuit mechanisms involved remain entirely unknown.
Understanding cortical circuit dynamics via synaptic and inhibitory mechanisms
Addressing some of the stated goals requires monitoring and manipulation of neurons in behaving animals with the specificity of cell-types and and synapses. We are using optogenetics assisted cell type specific recordings of different inhibitory neurons and spike timing cross correlation tools (Fig.4) to understand how neural circuit dynamics is shaped by the ongoing behavioral demands and internal states.
Figures
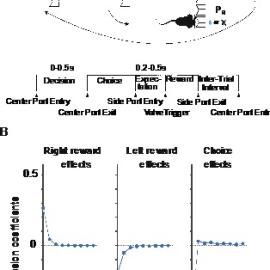
Figure 1. Reward and choice history effects in dynamic reward foraging task. A) Probabilistic reward foraging task showing the trial structure and behavioral epochs. Upper panel (cartoon) shows the task relevant behavioral events. Reward is delivered in a probabilistic way after mice poke their nose into one of the side ports. Probabilities stay fixed for a 50-150 trials (blocks) and change without signalling to the animals to different probabilities. The reward probabilities follow the baiting schedule, meaning that they increment for the unchosen side and reset to the original probabilities once the animals chooses that side. Lower panel shows timeline schematics for behavioral events. The broken lines indicate variable intervals and solid lines – fixed intervals between behavioral events. B) The regression coefficients of logistic regression for past right rewards, past left rewards, and past choices against current choices. The solid line shows the mean and shaded area s.e.m. for n = 82 sessions combined.
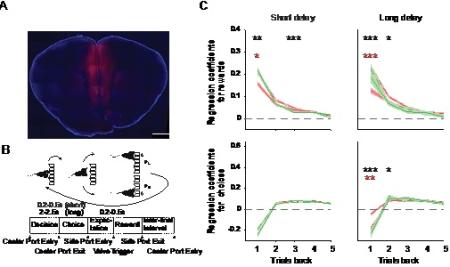
Figure 2. Behavioral effect of mPFC inactivation. A) Coronal brain section example of DREADD hM4D(Gi)-mcherry (in red) expression with DAPI (in blue) counterstaining in the mPFC with the scale bar (1 mm). B) Schematics of the task that indicates with short and long delays in the center port. C) The influence of past rewards (top panels) and choices (bottom panels) up to 5 trials back in history on current choices is depicted by linear regression coefficients in the short (left) and long delay (right) tasks. Broken lines indicate saline injections, solid lines represent CNO injections. Stars indicate * p < 0.05, ** p < 0.01, *** p < 0.001. Black stars indicate any difference in the means (using one way ANOVA test) between GFP, hM4D(Gi) animals treated with Saline or CNO. Red stars indicate the pairwise comparison between hM4D(Gi) animals treated with Saline and CNO. No significant pairwise differences were found in GFP animals, hence no green stars are shown.
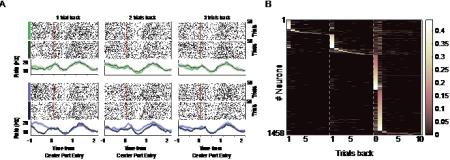
Figure 3. Trial history-specific representations of rewards and choices. A) Spike raster and peri event time histogram (PETH) plots of an example neuron aligned to center port entry time. Spike raster and PETH are separated by rewards (dark green) and no rewards (light green) for the left trials (upper panels) and rewards and non-rewards for the right trials (lower panel). Leftmost, middle, and rightmost panels show responses of the neuron to rewarded and non-rewarded trials separated by history of one, two, and three trials, respectively. PETH is convolved using a Gaussian filter with the window size of 2 ms and s.t.d. of 50 ms. B) A heatmap of the absolute regression coefficients. These coefficients are computed by regressing the trial-average firing rate of each neuron in the decision epoch against rewards and choices 10 trials back in history. Only significant coefficients after cross-validation on 1/5 of the test data and false discovery rate correction are plotted. The coefficients are sorted based on their maximum absolute value and divided horizontally into four groups: those affected by past right rewards, past left rewards, current choice, and past choices. These groups are separated by broken white line.
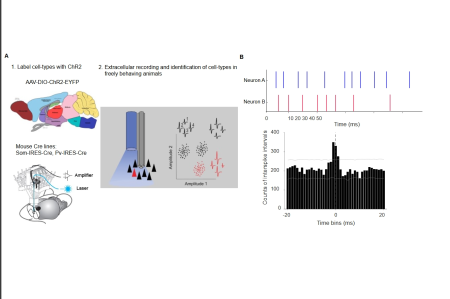
Figure 4. Optogentic tagging of cell types and identification of putative synaptic connections in behaving mice. A) Left upper panel shows the genetic labelling of specific interneuron cell types with Channelrhodopsin2 molecule using the mouse Cre lines. The bottom left panel shows the Microdrive that combines the electrophysiological and optical stimulation of neurons in behaving mice. The right panel shows the electrophysiological “tag” of the responsive neurons to optical stimulation. The responsive neuron (in red) have distinct spike features that enables further tracking of these neurons in non-stimulated periods. B) The illustration depicts the timing of spikes from two neurons, accompanied by a histogram that represents the intervals between these spikes. The peak that precedes or follows the zero bin indicates that the neurons engage in excitatory connections. Peak around zero bin indicates that the neurons receive common excitatory connections. Troughs indicate the inhibition. The gray lines indicate the same histogram of the shuffled spikes with 99.99% (upper line) and 0.001% (lower line) of the confidence intervals.